


AIOps · 04 of 5
Observability
The foundation: logs, metrics, traces, SLOs and alerts people can act on.




01
From code to dashboard to action
The observability foundation NGT builds before any AI is added, on open standards.
- 01Instrument
- OpenTelemetry in the app: a few lines or an agent
- Infrastructure and platform metrics too
- 02Collect & enrich
- A pipeline adds context and drops noise
- 03Store & query
- Back ends that scale on object storage
- Multi-tenant when teams share it
- 04Visualise & alert
- Golden signals, RED per endpoint, log volume
- Alerts on SLOs and measured baselines
- 05Respond
- Alerts to on-call, team chat and ITSM
- Runbooks and post-mortems
02
Measure what users feel first
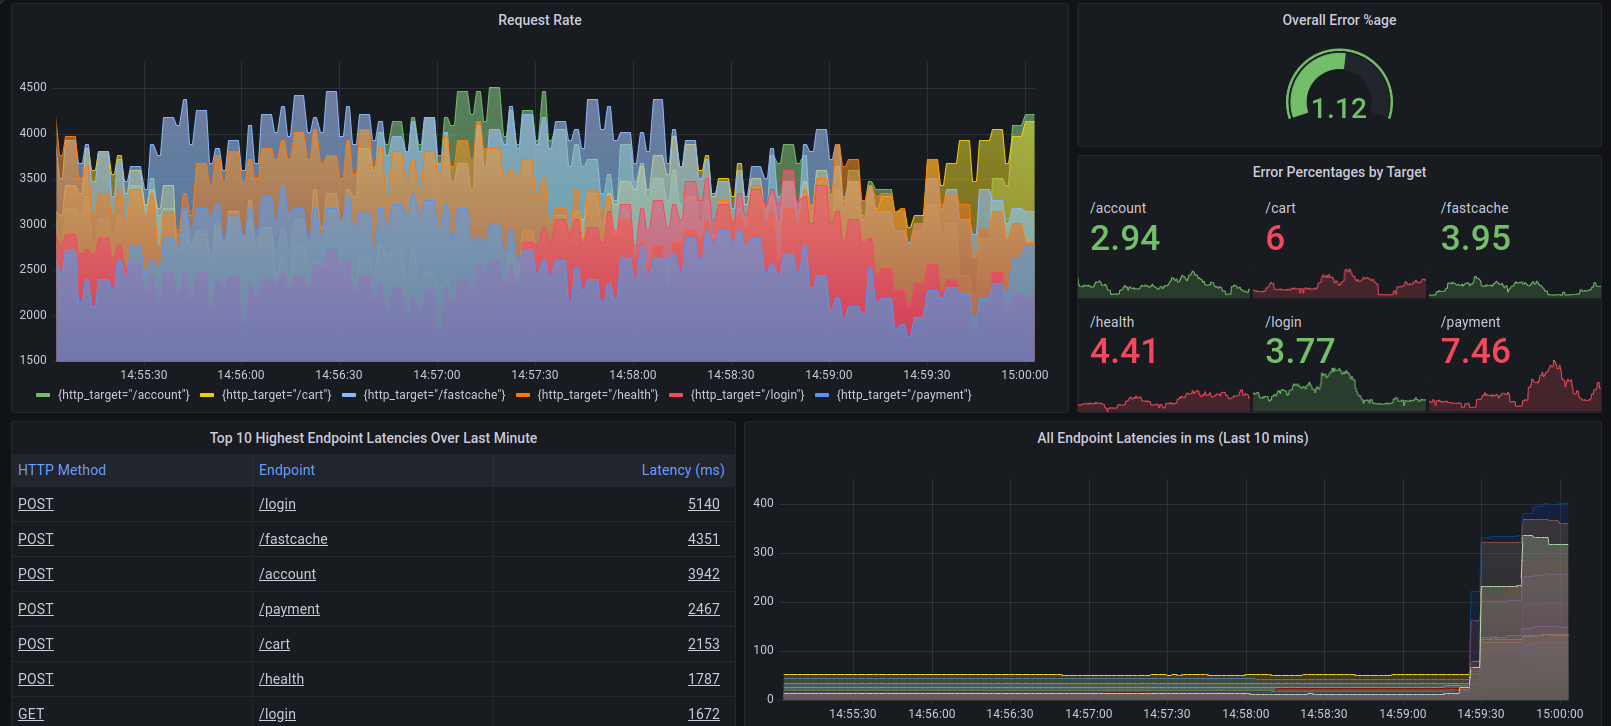
Then what the infrastructure is doing. A sample RED dashboard: rate, errors and latency per endpoint.
- Four golden signalsLatency, traffic, errors and saturation for user-facing systems.
- RED for services, USE for infrastructureRate, errors, duration per endpoint; utilisation, saturation, errors per resource.
- SLOs and error budgetsAgreed with the business; the budget decides when reliability work comes first.
- Digital experienceReal-user monitoring and synthetic checks show what customers see.
03
Alert hygiene comes before AI
AI on noisy alerts only makes noise faster. These practices from NGT's monitoring work come first.
Noisy monitoring Alert hygiene
Thresholds✕Default thresholds copied everywhere.✓Per-host thresholds from measured baselines, such as the last 30 days.
Coverage✕One failure fires five alerts; another fires none.✓Layered detection: each failure mode caught by exactly one layer.
First action✕The alert says something is wrong, not what to do.✓Every alert carries a first-action runbook line.
Silence✕A monitoring agent stops reporting; nobody notices.✓Heartbeat checks alert when signals go quiet.
New resources✕New servers run unmonitored.✓Automation picks up new resources as they are created.
Alert storms✕One outage sends hundreds of messages.✓Related alerts grouped; maintenance windows mute planned work.
04
Observability skills across the team
From a sample of 38 NGT engineer profiles. A sample, not the full headcount.
30 of 38NGT engineer profiles (sample) with projects building or running an observability stackNGT engineer profile sample, 38 CVs (2024–2026)
32 of 38NGT engineer profiles (sample) that list GrafanaNGT engineer profile sample, 38 CVs (2024–2026)
27 of 38NGT engineer profiles (sample) that list Amazon CloudWatchNGT engineer profile sample, 38 CVs (2024–2026)
18 of 38NGT engineer profiles (sample) that list ELK, EFK or OpenSearchNGT engineer profile sample, 38 CVs (2024–2026)
05
Tools we work with
Open standards first, and the commercial platforms our customers already run.
Metrics & dashboards

 Amazon CloudWatchAzure Monitor
Logs & traces
 Splunk
Incidents & IT service management

AI & automation for operations

 DifyLiteLLM
SourcesNGT AI-First DevOps Transformation service offering (Oct 2026)NGT Services Offering v2.0 (Mar 2025)NGT Cloud Operation service offering v0.2 (Jan 2025)NGT Cloud, DevOps & SRE capability deck (Sep 2026)FHN AI Transformation Service (Aug 2025)FHN AI Service Introduction v0.8.5 (Nov 2025) and v0.9.3 (Mar 2026)NGT engineer profile sample, 38 CVs (2024–2026)